Trend Identification(Ichimoku)
- Position of the price-action with respect to the cloud:
- When prices are closing below the cloud, it means a bearish trend or a downtrend.
- When the prices are closing over the cloud, it means a bullish trend or an uptrend.
- When the price action is inside the cloud, it means a range or a sideways movement.
- Position of the price-action with respect to various support and resistance levels
- The resistance and support levels are derived from the Tenkan Line, the Kijun Line, the upper edge of the cloud, and the lower edge of the cloud. These levels act as support when the price-action is above these levels, and the same levels become resistance when the price-action is below these levels.
- Strong Uptrend
- A strong uptrend is indicated when the price is above the cloud and continuously stays above the first level of support of the Tenkan sen.
- Strong downtrend:
- A strong downtrend is indicated when the price is below the cloud and continuously stays below the first level of resistance of the Tenkan Line.
- Position of the Chikou Span with respect to the cloud:
- Downward (bearish) pressure if the Chikou Span remains below the current price-action
- Upward (bullish) force if the Chikou Span remains above the current price-action
Resistance and Support Levels(Ichimoku)
- First level of resistance or support:
- Tenkan sen
- Kijun sen
- Senkou A/B
- Second level of resistance or support:
- Second level:Kijun sen
- When the price-action breaks below the Tenkan sen during an upward move, then the Kijun sen becomes the second level of support.
- Similarly, when the price-action breaks above the Tenkan sen during a downtrend, then the Kijun sen becomes the second level of resistance.
- Third and forth levels of resistance or support:
- The third and fourth levels of resistance or support are either the upper edge or the lower edge of the cloud.
- When the price-action is above the cloud during an uptrend and both the first and second levels of support of the Tenkan Line and the Kijun Line are broken, then the upper edge and the lower edge of the cloud become the third and fourth levels of support, respectively.
- Similarly, during a downtrend, when the price-action is below the cloud and breaks above the resistance of the Tenkan Line and the Kijun Line, then the lower edge and the upper edge of the cloud become the third and fourth levels of resistance, respectively.
Pivot points
- The accuracy of using pivot lines increases when Japanese candlestick formations can also be identified.
- Determine critical support and/or resistance levels.
- Spot key levels that need to be broken for a move to qualify as a breakout.
- The pivot point is seen as the primary support or resistance level.
- The price of a major currency pair tends to fluctuate between the support and resistance levels identified by the pivot point calculation.
- The trading range for a session usually occurs between the pivot point and the first support and resistance levels because a multitude of traders play this range.
- One of the key points to understand when trading pivot points is that breaks tend to occur around one of the market opens.
- During the quieter time periods, such as between the U.S. close (4pm EDT) and the Asian open (7pm EDT) (and sometimes even throughout the Asian session, which is the quietest trading session), prices may remain confined for hours between the pivot level and either the support or resistance level.
Pivot strategies
Common gaps
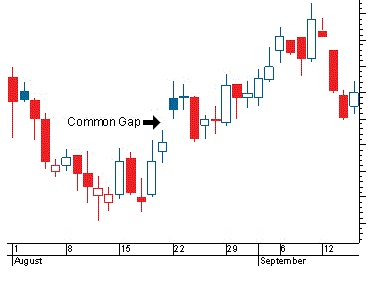
- In general, there is no major event that precedes this type of gap. These gaps are brought about by normal market forces and, as the name implies, are very common.
- Common gaps generally get filled relatively quickly when compared to other types of gaps.
- Common gaps are also known as "area gaps" or "trading gaps".
Breakaway gaps
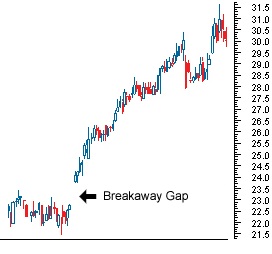
- The most exciting type of gap is known as a breakaway gap. A breakaway gap represents a gap in the movement of a stock price supported by levels of high volume.
- A Breakaway gap takes place at a key level of price support or ceiling.The significance in a breakaway gap is that everyone holding back price at a certain level has obviously rushed out of the trade in such a way that the current trend may likely resume with little push back.
- A breakaway gap is similar to a seismic shift that can alter the likely route of price action for a significant amount of time to come.
Runaway gaps
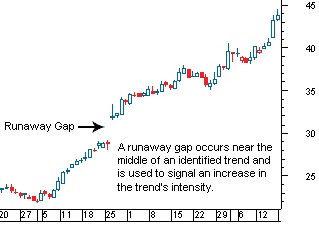
- A type of gap on a price chart that occurs during strong bull or bear movements characterized by an abrupt change in price and appearing over a range of prices.
- Sudden price changes are expected during strong bull and bear markets. However, most analysts view these gaps as temporary, expecting prices to converge upon the range in which the gap occurred in order to fill the missing segments.
Exhaustion gaps
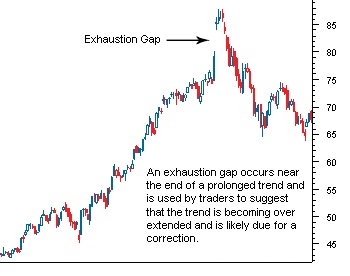
- A gap that occurs after the rapid rise in a stock's price begins to tail off. An exhaustion gap usually reflects falling demand for a particular instrument.
- Many technical analysts consider it a temporary gap. The range in prices gapped by the decrease in demand is expected to be filled once demand and the upward pressure on price are re-ignited.
Volume
- 29
- --
- --
Convergence/Divergence
- 30
- --
- --
Rising wedge
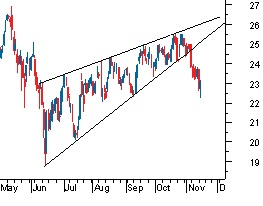
- A rising wedge is a bearish pattern that signals that the instrument is likely to head in a downward direction. The trendlines of this pattern converge, with both trendlines slanted in an upward direction.
- The price movement is bounded by the two converging trendlines. As the price moves towards the apex of the pattern, momentum is weakening. A move below the lower support would be viewed by traders as a reversal in the upward trend.
- As the strength of the buyers weakens (exhibited by their inability to take the price higher), the sellers start to gain momentum. The pattern is complete, with the sellers taking control of the security, when the price falls below the supporting trendline.
Falling wedge
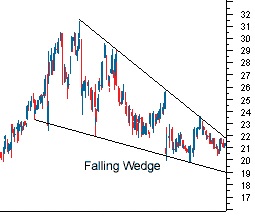
- The falling wedge is a generally bullish pattern signaling that one will likely see the price break upwards through the wedge and move into an uptrend. a wedge is similar to the triangles, in that the price movement bounces between the two trendlines, which are bounding the price movement.
- Another thing to look at in the falling wedge is that the upper (or resistance) trendline should have a sharper slope than the support level in the wedge construction. When the lower (or support) trendline is clearly flatter as the pattern forms, it signals that selling pressure is waning, as sellers have trouble pushing the price down further each time the security is under pressure.
- The price movement in the wedge should at minimum test both the support trendline and the resistance trendline twice during the life of the wedge. The more times it tests each level, especially on the resistance end, the higher quality the wedge pattern is thought to be.
- The buy signal is formed when the price breaks through the upper resistance line. This breakout move should be on heavier volume, but due to the longer-term nature of this pattern, it's important that the price has successive closes above the resistance line.
Symetrical triangle
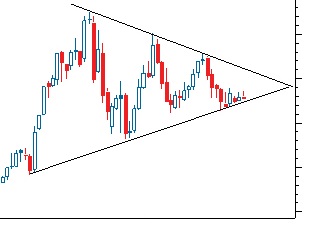
- The symmetrical triangle is mainly considered to be a continuation pattern that signals a period of consolidation in a trend followed by a resumption of the prior trend. It is formed by the convergence of a descending resistance line and an ascending support line.
- The two trendlines in the formation of this triangle should have a similar slope converging at a point known as the apex. The price of the security will bounce between these trendlines, towards the apex, and typically breakout in the direction of the prior trend.
- If preceded by a downward trend, the focus should be on a break below the ascending support line.
- If preceded by an upward trend, look for a break above the descending resistance line. However, this pattern doesn't always lead to a continuation of the previous trend.
- However, this pattern doesn't always lead to a continuation of the previous trend. A break in the opposite direction of the prior trend should signal the formation of a new trend.
- The pattern is complete when the price breaks out of the triangle - look for an increase in volume in the direction of the breakout. This pattern is also susceptible to a return to the previous support or resistance line that it just broke through, so make sure to watch for this level to hold if it does indeed break out.
Ascending triangle
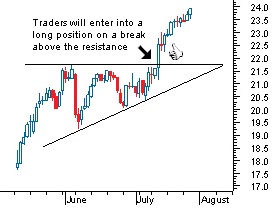
- The ascending triangle is a bullish pattern, which gives an indication that the price of the instrument is headed higher upon completion.
- The pattern is formed by two trendlines: a flat trendline being a point of resistance and an ascending trendline acting as a price support.
- The price of the security moves between these trendlines until it eventually breaks out to the upside. This pattern will typically be preceded by an upward trend, which makes it a continuation pattern; however, it can be found during a downtrend.
- The most telling part of this pattern is the ascending support line, which gives an indication that sellers are starting to leave the instrument. After the sellers are knocked out of the market, the buyers can take the price past the resistance level and resume the upward trend.
- The pattern is complete upon breakout above the resistance level, but it can fall below the support line (thus breaking the pattern), so be careful when entering prior to breakout.
Descending triangle
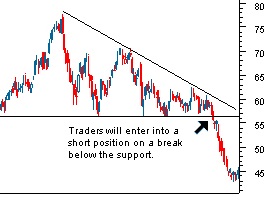
- The descending triangle is the opposite of the ascending triangle in that it gives a bearish signal to chartists, suggesting that the price will trend downward upon completion of the pattern. The descending triangle is constructed with a flat support line and a downward-sloping resistance line.
- Similar to the ascending triangle, this pattern is generally considered to be a continuation pattern, as it is preceded by a downward trendline. But again, it can be found in an uptrend.
- This pattern indicates that buyers are trying to take the security higher, but continue to face resistance. After several attempts to push the stock higher, the buyers fade and the sellers overpower them, which sends the price lower.
Rectangles
- A price chart or graph may be thought of as an X-ray of supply and demand. A rectangle pattern where supply and demand are in approximate balance for an extended period of time. The pair moves in a narrow range, hitting resistance at the rectangle's top and finding support at its bottom.
- It is a pattern which shows trader indecision, one in which the bulls and bears are approximately equally powerful.
- The rectangle can serve as either a reversal or continuation formation. As a reversal pattern, it ends a trend either up or down.
- As a continuation pattern, it signifies a pause in the prevailing trend, with the expectation that the prior trend will eventually resume.
- As a reversal pattern, it ends a trend either up or down.
- In either case, the rectangle shows a tug of war between buyers and sellers. Ultimately, either accumulation or distribution prevails, and the shares breakout or breakdown.
Flag
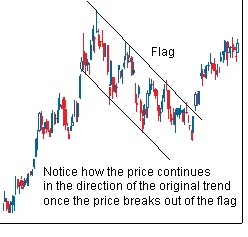
- The flag and pennant patterns are two continuation patterns that closely resemble each other, differing only in their shape during the pattern's consolidation period. These two patterns are formed when there is a sharp price movement followed by generally sideways price movement, which is the flag or pennant. The pattern is complete when there is a price breakout in the same direction of the initial sharp price movement.
- The flag pattern forms what looks like a rectangle. The rectangle is formed by two parallel trendlines that act as support and resistance for the price until the price breaks out.
- In general, the slope of the flag should move in the opposite direction of the initial sharp price movement; so if the initial movement were up, the flag should be downward sloping.
- The buy or sell signal is formed once the price breaks through the support or resistance level, with the trend continuing in the prior direction. This breakthrough should be on heavier volume to improve the signal of the chart pattern.
Pennant
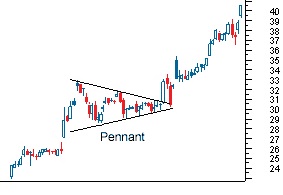
- The flag and pennant patterns are two continuation patterns that closely resemble each other, differing only in their shape during the pattern's consolidation period.
- The pennant forms what looks like a symmetrical triangle, where the support and resistance trendlines converge towards each other.
- The pennant pattern does not need to follow the same pa-02 found in triangles, where they should test each support or resistance line several times.
- Also, the direction of the pennant is not as important as it is in the flag; however, the pennant is generally flat.
- While the construct of the pause in the trend is different for the flag and pennant, the attributes of the chart patterns themselves are similar. It is vital that the price movement prior to the flag or pennant be a strong, sharp move.
- Typically, these patterns take less time to form during downtrends than in uptrends. In terms of pattern length, they are generally short-term patterns lasting one to three weeks, but can be formed over longer periods.
- The volume, as with most breakout signals, should be seen as strong during the breakout to confirm the signal.
- Upon breakout, the initial price objective is equal to the distance of the prior move added to the breakout point.
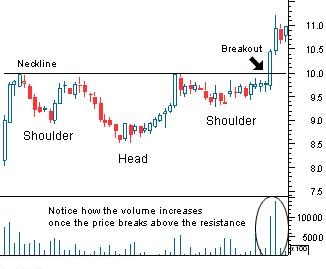
Head & Shoulders
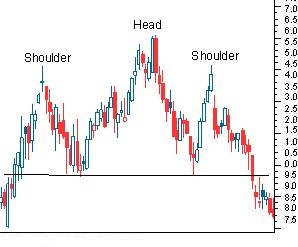
- The standard head-and-shoulders top pattern is a signal that a currency pair is set to fall once the pattern is complete, and is usually formed at the peak of an upward trend.
- The patterns are confirmed when the neckline is broken, after the formation of the second shoulder. The head and shoulders are sets of peaks and troughs. The neckline is a level of support or resistance. An upward trend, for example, is seen as a period of successive rising peaks and rising troughs.
- A downward trend, on the other hand, is a period of falling peaks and troughs. The head-and-shoulders pattern illustrates a weakening in a trend where there is deterioration in the peaks and troughs.
- 1. The formation of the left shoulder is formed when the currency pair reaches a new high and retraces to a new low.
- 2. The formation of the head occurs when the currency pair reaches a higher high, then falls back near the low formed in the left shoulder.
- 3. The formation of the right shoulder formed with a high that is lower than the high formed in the head but is again followed by a fall back to the low of the left shoulder.
- 4. The price falls below the neckline. In order words, the price falls below the support line formed at the level of the lows reached at each of the three lows mentioned previously.
Inverted Head & Shoulders
- The inverse head-and-shoulders pattern is the exact opposite of the head-and-shoulders top, because it indicates that the currency paid is set to make a move upwards.
- After the fourth step (when the neckline is broken), the currency pair should be heading in a new direction. It is at this point when most traders following the pattern would enter into a position.
- However, there is one scenario where this might not happen and the currency pair subsequently returns back to the previous trend. This is known as a "throwback" move, which occurs when the price breaks through the neckline, setting a new high or low, but then retreats back to the neckline.
- While it may be an issue to see a currency pair return to its original trend, it might not be a serious concern. The throwback could be a successful test of the new level of support or resistance, which would ultimately help to strengthen the pattern and further confirm its new trend.
- So, some patience is required in order to wait for the pattern to test out and not close the position out too quickly - before the pattern makes its bigger moves.
Double tops
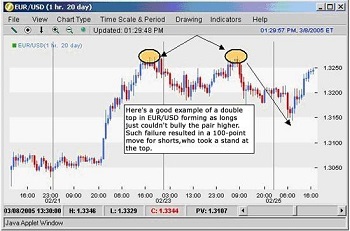
- The double-top pattern is found at the peaks of an upward trend and is a clear signal that the preceding upward trend is weakening and that buyers are losing interest. Upon completion of this pattern, the trend is considered to be reversed and the currency pair is expected to move lower.
- It's important to note that the price does not need to touch the level of resistance but should be close to the prior peak.
- Also, when using this chart pattern one should wait for the price to break below the key level of support before entering. Trading before the signal is formed can yield disastrous results, as the pattern is only setting up the possibility for the trend reversal and could trade within this banded range for some time without falling through.
- This pattern is a clear illustration of a battle between buyers and sellers. The buyers are attempting to push the currency pair but are facing resistance, which prevents the continuation of the upward trend.
- After this goes on a couple of times, the buyers in the market start to give up or dry up, and the sellers start to take a stranglehold of the security, sending it down into a new downtrend.
- Again, volume should be an important focus as one should look for an increase in volume when the currency pair falls below the support level.
- Also, as in other chart patterns, do not be alarmed if there is a return to the previous support level that has now become a resistance level in the newly established trend.
Double bottoms
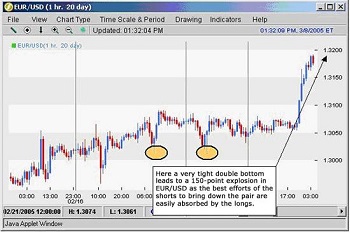
- This is the opposite chart pattern of the double top as it signals a reversal of the downtrend into an uptrend.
- The pattern is confirmed when the price moves above the resistance the security faced on the prior move up.
- Remember that the security needs to break through the support line to signal a reversal in the downward trend and should be done on higher volume.
- As in the double top, do not be surprised if the price returns to the breakout point to test the new support level in the upward trend.
- In both the double top and double bottom, the initial price objective can be measured by taking the price distance between the support and resistance levels or the range that chart pattern trades.
- In double tops and double bottoms one thing to remember is that the price on the second test does not always need to reach the same distance as the first test.
- Another problem that can occur is the second testing point, where the top or bottom actually breaks the level that the first top or bottom test created. If this occurs, it can give a signal that the previous trend will continue - instead of reverse - as the pattern suggests. However, don't be too quick to abandon the pattern as it could still materialize.
- If the price does, in fact, move above the prior test, look to see if the move was accompanied by large volume, suggesting a trend continuation.
- If on the second test of a double bottom the price falls below the support line on heavy volume, it is a good sign the downward trend will continue and not reverse. If the volume is very weak, it could just be a last attempt to continue the downward trend, but the trend will ultimately reverse.
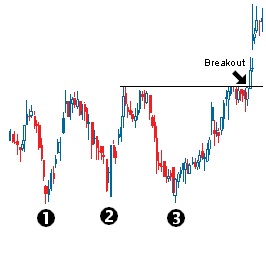
Triple tops

- This bearish reversal pattern is formed when a security that is trending upward tests a similar level of resistance three times without breaking through. Each time the currency pair tests the resistance level, it falls to a similar area of support.
- After the third fall to the support level, the pattern is complete when the currency pair falls through the support; the price is then expected to move in a downward trend.
- This pattern can be difficult to spot in the early stages as it will initially look like a double-top pattern, which was discussed in a previous section.
- The most important thing here is that one waits for the price to move past the level of resistance before entering the security, as the currency pair could actually just end up being range-bound, where it trades between the two levels for some time.
- In the triple-top formation, each test of resistance at the upper end should be marked with declining volume at each successive peak. And again, when the price breaks below the support level, it should be accompanied by high volume.
- Once the signal is formed, the price objective is based on the size of the chart pattern or the price distance between the level of resistance and support. This is then deducted from the breakout point.
Triple bottoms
- This bullish reversal pattern has all of the same attributes as the triple top but signals a reversal of a downward trend.
- In this pattern, volume plays a role similar to the triple top, declining at each trough as it tests the support level, which is a sign of diminishing selling pressure. Again, volume should be high on a breakout above the resistance level on the completion of the pattern.
- The significance of these two formations is that an established trend has hit a major section of support/resistance, which stops the trend's ability to continue.
- This is an indication that the buying or selling pressure that is supporting the trend is beginning to weaken. It also is an indication that the opposite pressure is gaining strength.
- The chart pattern is signaling that there is a shift in the supply and demand of the security and of the balance between buyers and sellers. When a reversal signal is formed in a triple top, there is a shift from buyers moving the security upward to sellers moving the security downward.